Table of Contents
2023-02-09
Container runtime performancePerformance comparison: GKE vs. EKS
The solid performance of managed Kubernetes platforms is generally regarded as a given and is hardly ever put into question. However, maybe there is a difference in how containers perform on different popular managed Kubernetes platforms. I wanted to take a deeper look and selected the two most popular Kubernetes services we use at Blueshoe for our clients: Amazon Elastic Kubernetes Service (EKS) and the Google Kubernetes Engine (GKE).

EKS vs. GKE – and why does it matter?
According to this statistic from February 2020, 540 respondents answered the question ‘Which of the following container orchestrators do you use?’ with:
- 37% of all respondents use EKS
- 21% of the respondents use GKE
Please bear in mind that the selection of multiple answers was possible, hence why the groups are not exclusive. The numbers have probably changed a bit since then, but it’s obvious that these two are very popular choices in the world of managed Kubernetes. The numbers also match the distribution of Kubernetes platforms that are under Blueshoe’s management to date.
Naturally, we should start the container runtime performance analysis with these two solutions.
But why?
For one thing, it’s simply interesting to establish how these two big players perform against each other. On the one hand, you’ve got Amazon Web Services – the giant in the market of hyperscalers. And on the other hand, there is Google – the tech titan and pioneer of Kubernetes.
But more importantly, it always boils down to the costs. If you can get 10% more performance at comparable pricing, some might want to take advantage of Kubernetes’ portability. This is not about the ecosystem or potentially attached services (such as managed databases or storage), but rather the pure container runtime performance. I wanted to answer the question: ‘At which speed runs my code in a very standard Kubernetes cluster?’. And this is what I found:
The Benchmark Setup
On EKS, I created a Kubernetes cluster with the following specs:
- Instance type: t3.xlarge
- Region: eu-west-1
- K8s version: 1.23
- OS: Amazon Linux 2
- Container runtime: docker
- Node VM pricing: 0.1824 USD per hour
To match these parameters as accurately as possible, I created a Google Kubernetes Engine cluster with the following specs:
- Instance type: e2-standard-4
- Region: europe-north1-a
- K8s version: 1.23.14-gke.401
- OS: Container-Optimized OS with containerd (cos_containerd)
- Container runtime: containerd
- Node VM pricing: 0.147552 USD per hour
Both machine types incorporate a 4 vCPU machine with 16 GB of RAM based on an Intel processor. The Kubernetes node running the test was dedicated to the test pod and only filled with other ‘default’ pods of that managed Kubernetes offering. I did not use any special configurations, I simply ordered a cluster with the defaults set.
How to benchmark the container runtime
One of the main goals of running a performance analysis is to enable very easy replication. Luckily, we’re talking about Kubernetes, which means that it’s just a matter of writing Kubernetes configs and applying them to the cluster. Yet, a few things are still important:
- chose comparable Kubernetes node instance types, make the comparison as fair as possible
- do not deploy the benchmark workload next to other containers
- use the same Kubernetes version
- note down any important differences between the contestants
Unfortunately, it wasn’t exactly easy to find a good benchmark tool that can serve the needs to benchmark the following parts:
- the CPU
- the memory (RAM)
- the container filesystem (not the attached volumes, this is about the native filesystem)
A quite commonly used tool with only a few known weaknesses is sysbench. With about 5k stars on GitHub and a rather large and active community, it may be suitable for my requirements. A big plus is the extensibility and the many built-in complex benchmark types, such as database benchmarks etc.
Luckily, someone at Severalnines has created a container image for sysbench already and made it public. So the benchmarking tool is ready.
To simplify this process and make it easily reproducible, I started a little test runner for sysbench. This tool schedules the benchmark in the cluster (with a node selector), waits for the job to complete, parses the result and compiles a file with the test results.
I made the code public here. It is based on Python and Poetry. If you do have Poetry installed, you can simply run poetry run benchmark
OUR KUBERNETES PODCAST
TftC E1: Kubernetes development environments
Michael and Robert are talking in depth about the ins and outs of local Kubernetes development and also provide some real coding examples.
More editions of our podcast can be found here:
Show moreThe Results
To start with the summary, it turned out that EKS provides higher performance across all metrics. The file IO performance in particular is, frankly, poor with GKE. We are talking about 10% less performance on the CPU, 9% less on memory and a huge gap in file operations for a default Kubernetes cluster. Let’s take a deeper look at the results.
CPU Performance
The sysbench command for running the CPU test is: sysbench --test=cpu --time=60 run
This command executes the CPU benchmark for one minute.
1) GKE vs EKS: CPU events per second
sysbench captures the executed loops (aka events) calculating all prime numbers up to a certain parameter in a given timeframe. It indicates how much CPU time was granted to the process and how fast the calculation was in general.
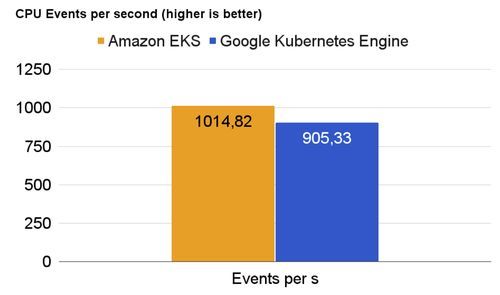
The result shows a shocking difference between EKS and GKE of about 11% more events on EKS. Since you do pay for the time of your Kubernetes node, getting more calculations done in that time is essential.
2) GKE vs. EKS: CPU latency
Sysbench records the CPU latency for a requested event. It aggregates the results and returns the minimum, maximum, average and 95th percentile values.
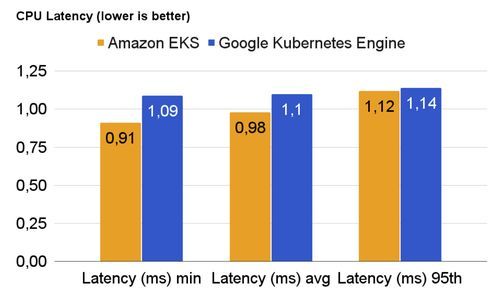
As you can see, the performance of GKE’s containerd-based runtime is not significantly slower than the docker-based runtime of EKS. Yet, the difference in the 95th percentile is about 2%. This can be attributed to the rather short runtime of the benchmark and other factors.
Memory Performance
The sysbench command for running the memory (RAM) test is: sysbench --test=memory --memory-total-size=500G run
This command writes 500 Gigabytes to the main memory and captures the speed of writing.
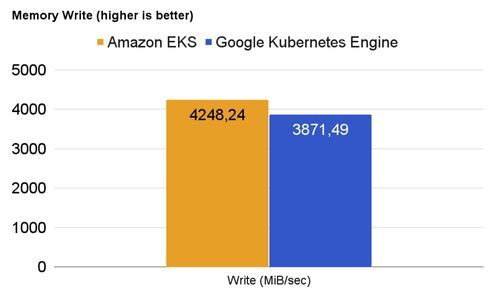
Again, GKE is roughly 9% slower than the container runtime of EKS when it comes to writing a lot into the main memory. On an EKS cluster, your code can potentially write with 4.25 Gigabytes per second into RAM, while on GKE, your container can only shovel with 3.87 Gigabytes per second. However, compared to my laptop, which runs at about 6.36 Gigabytes per second, neither result is overwhelming
GKE vs EKS: File I/O Performance
The filesystem performance results paint a particularly dramatic picture. The sysbench command for running the file test is:
- sysbench --test=fileio --file-num=5 --file-total-size=5G prepare
- sysbench --test=fileio --file-total-size=5G --file-num=5 --file-test-mode=rndrw --time=100 --max-requests=0 run
1) GKE vs EKS: File throughput
The file throughput benchmark simply writes a file to the filesystem and reads an artificial file from the filesystem.
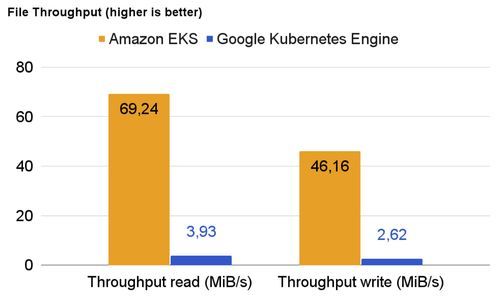
The write and read performance of a container running on EKS is about 95% better on read operations and 94% better on write operations. This metric could become relevant if an application writes and reads files from temporary storage in the container.
2) File input/output latency
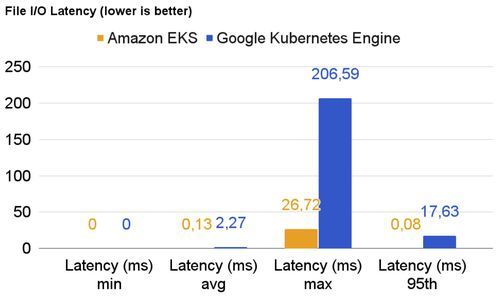
The file latency is almost on par for both platforms. Personally, I’d not put too much importance on the maximum latency (this can vary a lot per run), but rather look at the 95th percentile. With this metric, EKS outperforms GKE by an order of magnitude.
3) File operations per second
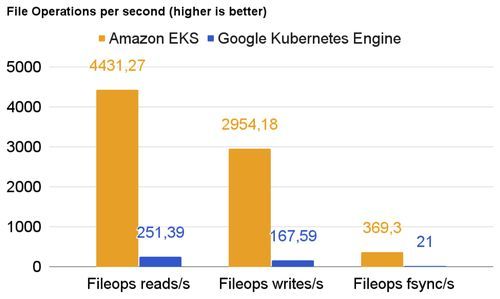
The poor file operations per second on GKE are just a consequence of the results before. Please keep in mind that these filesystem performance evaluations are executed on the container’s native filesystem. There is no additional storage class attached to the pod running the benchmark.
Closing Remarks
I was a bit shocked about the results after comparing these two managed Kubernetes platforms and their container runtime performance. As you can see, the price of the GKE node is about 22% lower (in these regions) than the counterpart at AWS EKS. It compensates at least a bit for the difference in performance, but having these facts at hand may influence the decision of where to place a containerized workload in the future.
When trying to comprehend the results, I found Amazon’s Nitro system, a hardware technology that Amazon Web Service developed for their own cloud computing. Are these results proof of the promised performance gains? Does the docker-based container runtime on AWS play a part in this?
At Blueshoe, we love to work with the Google Cloud Platform, as we generally consider it more user-friendly and clear compared with the AWS console. Performance considerations are indeed very important, but there are other essential criteria, too, when it comes to selecting a managed Kubernetes offering. Also, please read this benchmark with a grain of salt, as there are plenty of configurations one may choose that can have a huge impact on the overall system performance.
Feel free to follow me on LinkedInor join our discord.


